

“Stocks that are in favor tend to fall out of favor, and vice versa.”
Annual stock performance rankings are a field day for contrarians: one year’s worst years are often the next year’s best, and vice versa.
Think of Nvidia NVDA,
This is by far the best-performing stock this year among stocks in the S&P 500 SPX — up 214.6% through Nov. 7, according to FactSet. Last year, Nvidia was among the worst, down 50.3% and underperforming 475 of the other stocks in the S&P 500.
As wonderful as this turnaround is, it is not unique. Investors should heed the contrarian lesson and consider buying stocks at the bottom of the performance rankings.
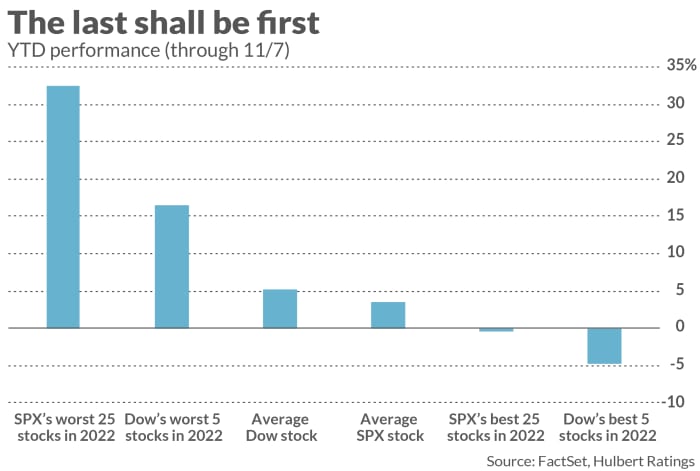
The graph below summarizes the turnaround between 2022 and 2023. Last year’s worst 25 stocks in the S&P 500 are up an average of 32.5% so far this year, while last year’s best 25 have lost an average of 0.4%. A similar story is told by the blue chip stocks that make up the Dow Jones Industrial Average DJIA.
Last year’s worst performer was Salesforce CRM,
with a loss of 47.8%. So far this year, Salesforce is the best performer in the Dow Jones, with a gain of 59.8% this year.
The main driver of these year-over-year reversals is investor sentiment, with tax loss selling and year-end window dressing playing a supporting role. Sentiment is the main culprit, as investor mood fluctuates between extremes. When they are bullish on a stock, they tend to get way over-enthusiastic; the exact opposite is true when a stock falls out of favor. In true contrarian fashion, the stocks that are in favor tend to fall out of favor, and vice versa.
Tax-loss selling and year-end window dressing exacerbate these sentiment swings among a given year’s losing stocks. I recently devoted a column to these two phenomena and will therefore briefly summarize them here.
Tax-loss selling occurs when investors sell stocks at a loss to offset some of the capital gains they would have to pay taxes on. Year-end window dressing occurs when portfolio managers sell losers to avoid embarrassment in the year-end reports. In both cases, stocks that are already falling as the end of the year approaches are punished even more severely. It makes sense that they will bounce back in the new year.
Of course, it’s not the case that each year’s worst performer is a great performer the next year. So it’s important to do your homework, rather than automatically buying the worst of a given year. That said, a list of annual worst performers is a good place to start.
To get you thinking along these lines, consider the following list. It was built from the fifty stocks in the S&P 500 with the worst returns to date, and then further narrowed down to just the stocks recommended by at least two of the investment newsletters maintained by my performance monitoring company. Stocks are listed in descending order of losses since the beginning of the year.
| stock | Return to date (as of 11/7/23) |
|
Modern Inc (MRNA) |
-59.0% |
|
Walgreens Boots Alliance (WBA) |
-39.3% |
|
Pfizer Inc (PFE) |
-37.1% |
|
Comerica Inc (CMA) |
-33.3% |
|
Schwab Charles Corp New (SCHW) |
-32.8% |
|
Keycorp New (KEY) |
-31.8% |
|
Eversource energy (ES) |
-30.8% |
|
Burgers Finl Group Inc (CFG) |
-30.6% |
|
Smucker JM Co (SJM) |
-29.0% |
|
Tapestry Inc (TPR) |
-26.0% |
|
Crown Castle Inc (CCI) |
-25.8% |
|
Truist Finl Corp (TFC) |
-25.7% |
|
Bristol Myers Squibb Co (BMY) |
-24.7% |
Mark Hulbert is a regular contributor to MarketWatch. His Hulbert Ratings tracks investment newsletters that pay a flat fee to be reviewed. He can be reached at mark@hulbertratings.com
More: Why Warren Buffett has done more to educate investors than any other business leader
Plus: Beware of Wall Street’s myth of cash sitting on the sidelines